Business Analytics
DataArtha Solutions Business Analytics solutions provide organizations with the ability to analyze and understand their business data, identify trends, and make data-driven decisions. Our team of experts has extensive experience in implementing business analytics solutions for businesses of all sizes, across various industries. We use the latest business analytics technologies and tools to help organizations gain a competitive edge by leveraging their data.
We understand that data is a valuable asset for any business. That's why we offer a comprehensive range of Business Intelligence, Data Analytics, and Business Analytics Solutions to help our clients extract insights and value from their data. Our team of experienced data analysts and engineers work closely with clients to understand their unique needs and provide customized solutions that help them make data-driven decisions.
Business analytics is the process of using data, statistical algorithms, and various tools and techniques to understand and evaluate business performance and make data-driven decisions. It involves analyzing historical data to identify trends and patterns and using that information to make predictions about future performance. Business analytics can be used in a variety of areas, such as finance, marketing, operations, and human resources, to improve efficiency and effectiveness, and to gain a competitive advantage.
Business analytics includes a wide range of techniques, tools and methods to analyze data, such as descriptive statistics, data visualization, data mining, machine learning, and econometrics.
Descriptive statistics are used to summarize and describe the basic features of a dataset. Data visualization tools, such as charts and graphs, are used to present data in a clear and intuitive way. Data mining is the process of automatically discovering useful information from large datasets, while machine learning uses algorithms to learn from data and make predictions. Econometrics is the application of statistical methods to economic data.
Business analytics is used in a variety of business functions, such as:
Business analytics can also be used to improve decision-making, by providing insights that can inform strategic, tactical, and operational decisions. One of the key advantages of business analytics is that it can help organizations make better decisions by providing them with accurate and actionable insights into their performance. By using data and analytical methods to understand their operations, organizations can improve efficiency, reduce costs, and identify new opportunities for growth. There are a wide variety of tools available for business analytics, depending on the specific needs of an organization and the type of data being analyzed. Some common tools include:
It's worth noting that the selection of the tools depends on the specific requirements of the organization. Some organizations may require a full-fledged data warehousing and BI platforms, while others may be able to get by with simple spreadsheets.
At DataArtha Solutions, we understand the importance of data-driven decision making in today's fast-paced business environment. We work closely with our clients to understand their specific needs and provide a tailored business analytics solution that helps them gain insights into their data and make informed decisions. Contact us today to learn more about how we can help your business leverage its data to gain a competitive edge.

Features:
Benefits:

|
Marketing: Analyzing customer data to identify patterns and trends, and to segment customers for targeted marketing campaigns.
|

|
Finance: Analyzing financial data to identify patterns and trends, and to make predictions about future performance.
|
|
Operations: Analyzing data to optimize production, logistics, and supply chain operations.
|

|
Human Resources: Analyzing data to optimize workforce management and talent acquisition.
|
Business analytics can also be used to improve decision-making, by providing insights that can inform strategic, tactical, and operational decisions. One of the key advantages of business analytics is that it can help organizations make better decisions by providing them with accurate and actionable insights into their performance. By using data and analytical methods to understand their operations, organizations can improve efficiency, reduce costs, and identify new opportunities for growth. There are a wide variety of tools available for business analytics, depending on the specific needs of an organization and the type of data being analyzed. Some common tools include:
|
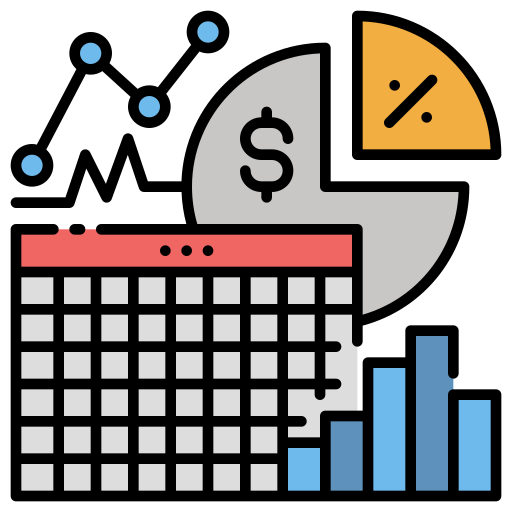
Spreadsheets: Excel is a popular tool for analyzing data, as it is relatively simple to use and can handle large amounts of data.
|
|
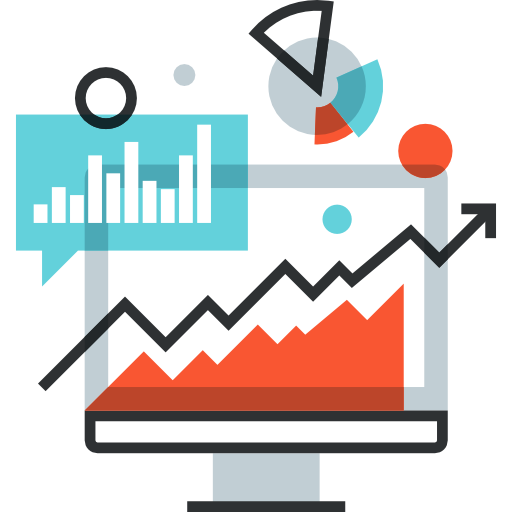
Data Visualization Tools: Tools such as Tableau and Power BI are used to create interactive and visually appealing charts and graphs to present data in a clear and intuitive way.
|

|
Data Warehousing and Business Intelligence (BI) Platforms: These tools are used to store, manage, and analyze large amounts of data from various sources, such as transactional systems, social media, and web analytics.
|
|
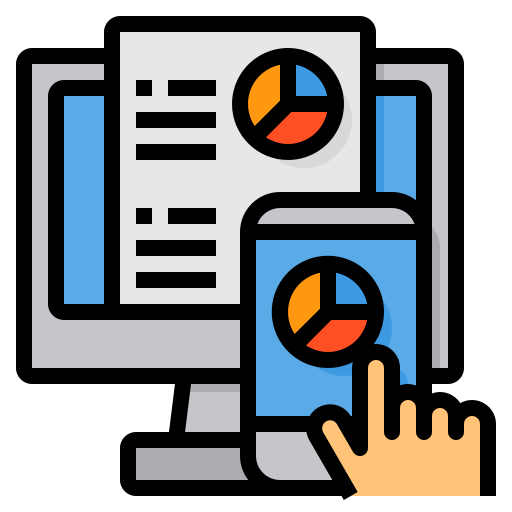
Statistical Analysis Software: Tools such as R and SAS are used to perform advanced statistical analysis, including data mining, machine learning and econometrics.
|
|
|
Cloud-based Analytics Platforms: Cloud-based platforms such as Google Analytics, AWS and Azure provide a range of analytical tools and services that can be accessed over the internet.
|
|
Custom-built Software: Create, manage, and secure APIs to allow different systems to share and access the same data through API management.
|


|
Data Integration: Combines data from various sources, including databases, applications, and spreadsheets.
|

|
Data Cleaning: Cleans and processes raw data to eliminate errors, duplicates, and inconsistencies.
|

|
Data Modeling: Builds mathematical models to represent data relationships and patterns.
|

|
Predictive Analytics: Uses statistical models to make predictions about future events or trends.
|

|
Descriptive Analytics: Helps understand and analyze historical data to identify patterns and trends.
|

|
Diagnostic Analytics: Helps in identifying the causes of past events or trends.
|

|
Prescriptive Analytics: Recommends the best course of action based on predictive analytics.
|

|
Real-Time Analytics: Provides insights in real-time for immediate decision-making.
|

|
Data Visualization: Helps users understand data trends and insights through interactive charts, graphs, and maps.
|
Benefits:

|
Better Decision Making: Helps in making informed business decisions based on data insights.
|

|
Improved Efficiency: Increases operational efficiency by automating and streamlining business processes.
|

|
Competitive Advantage: Provides a competitive edge by enabling faster and more accurate decision-making.
|

|
Increased Revenue: Helps in identifying new business opportunities and revenue streams.
|

|
Cost Reduction: Helps in reducing costs through better resource allocation and optimization.
|

|
Improved Customer Satisfaction: Provides insights into customer behavior and preferences, leading to better customer engagement and satisfaction.
|

|
Scalability: Scales to handle increasing volumes of data and users.
|

|
Faster Time-to-Market: Helps in bringing products and services to market faster by identifying market trends and customer needs.
|

|
Improved Collaboration: Enables sharing of data and insights across departments, leading to better collaboration and teamwork.
|